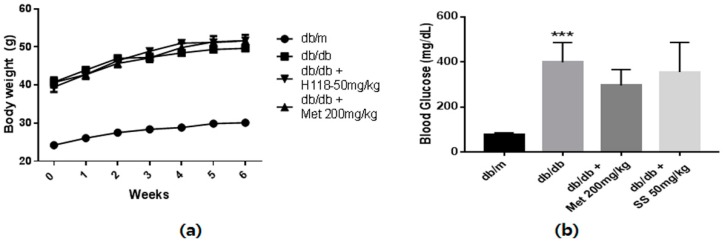
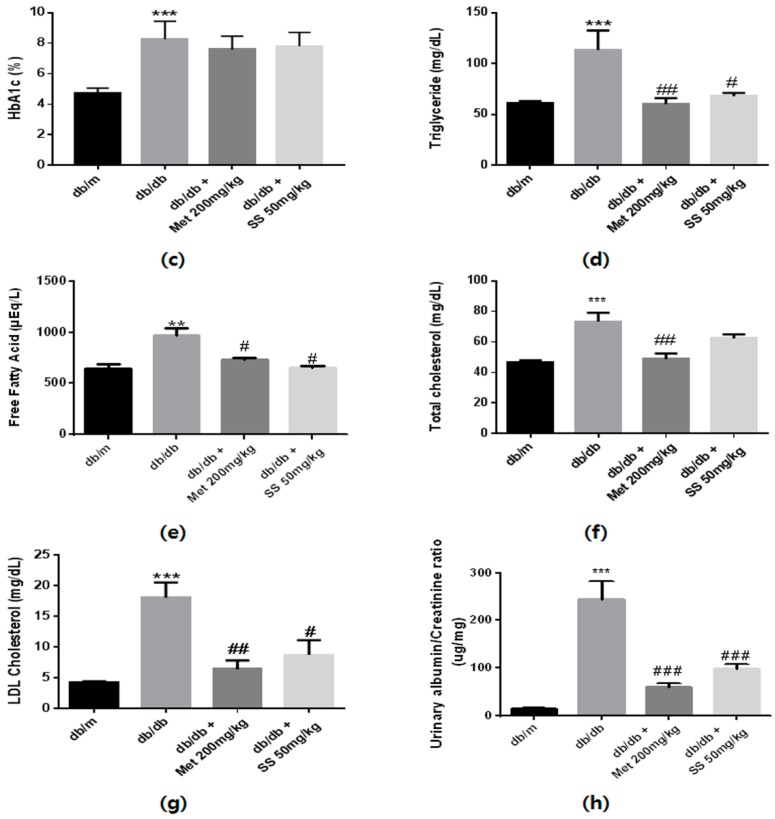
Figure 3.
Diabetes parameters and lipid profiles of db/db mice. (a) Time course of body weight changes in mice. (b) Fasting blood glucose levels of db/m and db/db mice following a 6-week treatment period and after 12 h of fasting. (c) Glycated hemoglobin (HbA1c) levels of db/m and db/db mice after a 6-week treatment period. (d) Serum triglyceride levels of db/m and db/db mice after a 6-week treatment period and 12 h of fasting. (e) Serum-free fatty acid levels of db/m and db/db mice after a 6-week treatment period and 12 h of fasting. (f) Serum total cholesterol levels of db/m and db/db mice after a 6-week treatment period and 12 h of fasting. (g) Serum low-density lipoprotein (LDL)-cholesterol levels of db/m and db/db mice after a 6-week treatment period and 12 h of fasting. (h) Urinary albumin/creatinine ratio of db/m and db/db mice after a 6-week treatment period and 12 h of fasting. Lipid profiles and urine albumin/creatinine ratio were determined using a commercial enzyme-linked immunosorbent assay kit according to the manufacturer’s protocol. Value are means ± standard error of the mean (SEM, ** p < 0.01; *** p < 0.001 vs. db/m; # p < 0.05, ## p < 0.01, and ### p < 0.001 vs. db/db).


