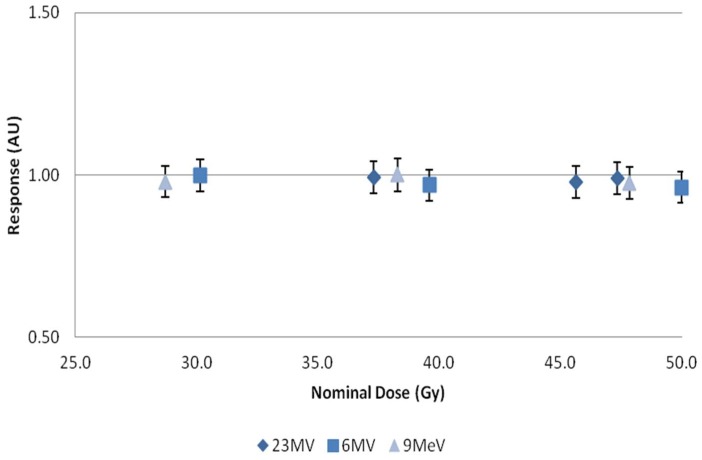
Figure 6.
Normalized response plotted against nominal dose for 23 MV, 6 MV, and 9 MeV beams. X-axis represents central axis dose for the depth of cuvette, and Y-axis the normalized dose response. Error bars represent a 5% variation from the mean; calculated standard deviations from n = 4 samples per data point, less than 1%.

