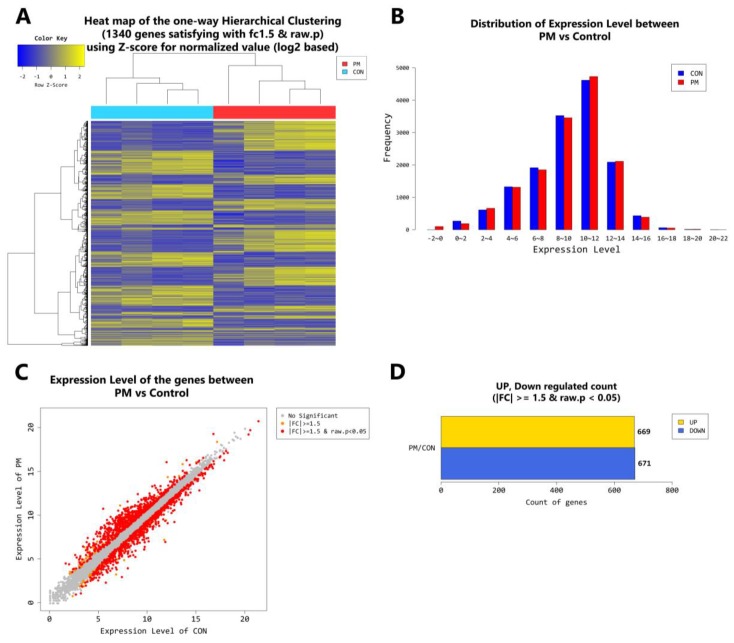
Figure 7.
(A) Heat map of the one-way hierarchical clustering (PM old vs. control old). (B) Distribution of gene expression level between PM-exposed and control old dermal fibroblasts. (C) Scatter plot of gene expression level. (D) Significant gene count by fold change and p-value. n = 4 in each group (PM old, control old). Only those genes exhibiting log2 fold change (FC) > 1.5 and p < 0.05 were considered as differentially expressed genes. For DEG (differentially expressed gene) set, hierarchical clustering analysis was done with complete linkage and Euclidean distance as a measure of similarity.

