Figure 4.
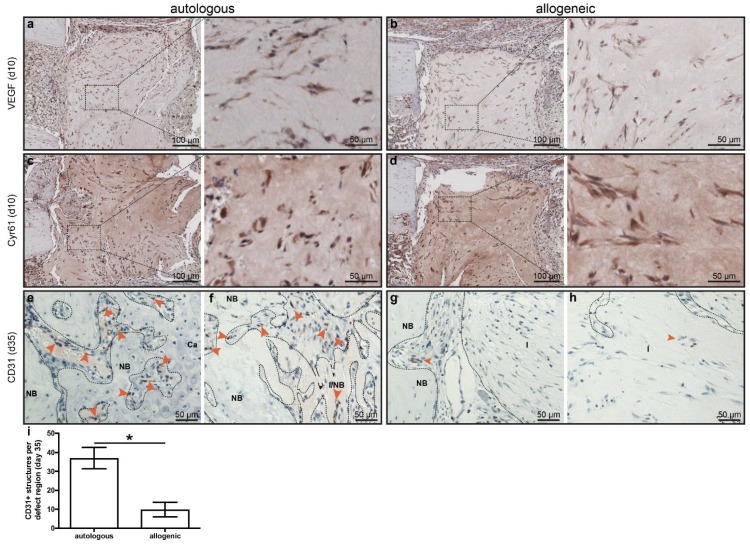
Expression of angiogenic markers. (a,b) Staining of vascular endothelial growth factor (VEGF) on day 10 in (a) mice with autologous human mesenchymal stem cells (hMSC) treatment and (b) mice with allogeneic hMSC treatment. (c,d) Staining for Cyr61 on day 10 in mice with (c) autologous hMSC treatment and (d) allogeneic hMSC treatment. (e–h) Staining of CD31 (PECAM) on day 35 in mice with (e,f) autologous hMSC treatment and (g,h) allogeneic hMSC treatment. (e) and (g) represent the edge of the implant while (f,k) represent the center of the implant. NB: new bone; Ca: cartilage, I: implant. Arrowheads indicate structures positive for CD31. (i) Quantification of CD31 staining. Dashed boxes indicate areas displayed in higher magnification. The data are presented as the mean ± SD, * p ≤ 0.05, autologous n = 2; allogeneic n = 6.

