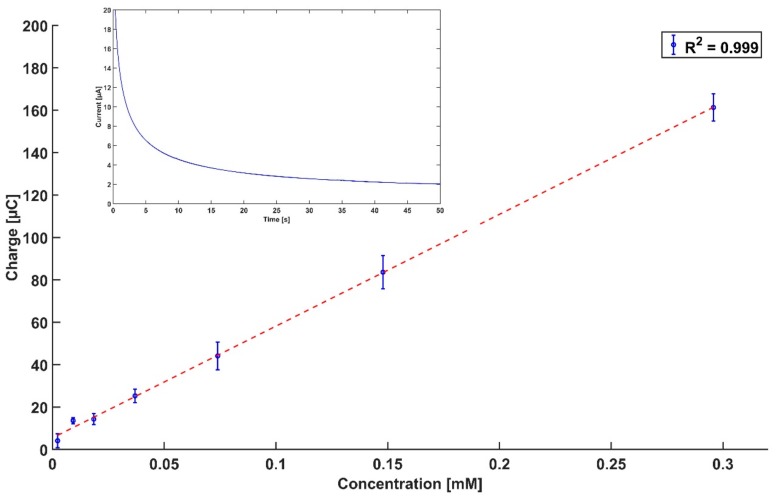
Figure 3.
Charge as a function of concentration calculated by integrating the measured current at a time interval of 50 s (n = 3, replicates from independent dilution series). The inset shows the amperometric measurement of 0.3 mM of Gly; the full dataset is presented in Supplementary Material, Figure S1.

