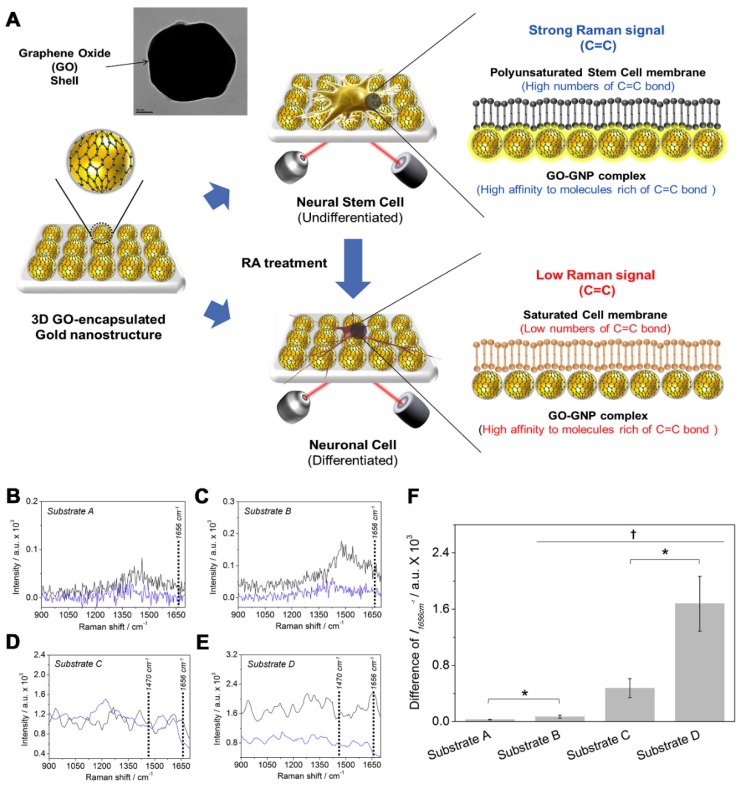
Figure 2.
(A) Detection strategy to monitor the differentiation of mouse neural stem cells (mNSCs). The cells were allowed to attach to a fabricated substrate; the detection time for the Raman spectra was 1 s in all experiments. Raman spectra of ( – ) undifferentiated or ( ) differentiated mNSCs on: (B) Substrate A; (C) Substrate B; (D) Substrate C; and (E) Substrate D. (F) Intensity difference of Raman peak at 1656 cm−1 (C=C bond) achieved from the undifferentiated mNSCs that were substrated by the differentiated cells († p < 0.05, N = 3, ANOVA test and * p < 0.05, Student’s t-test). (A–F) Reprinted with permission from [40]. Copyright 2018, Elsevier.

