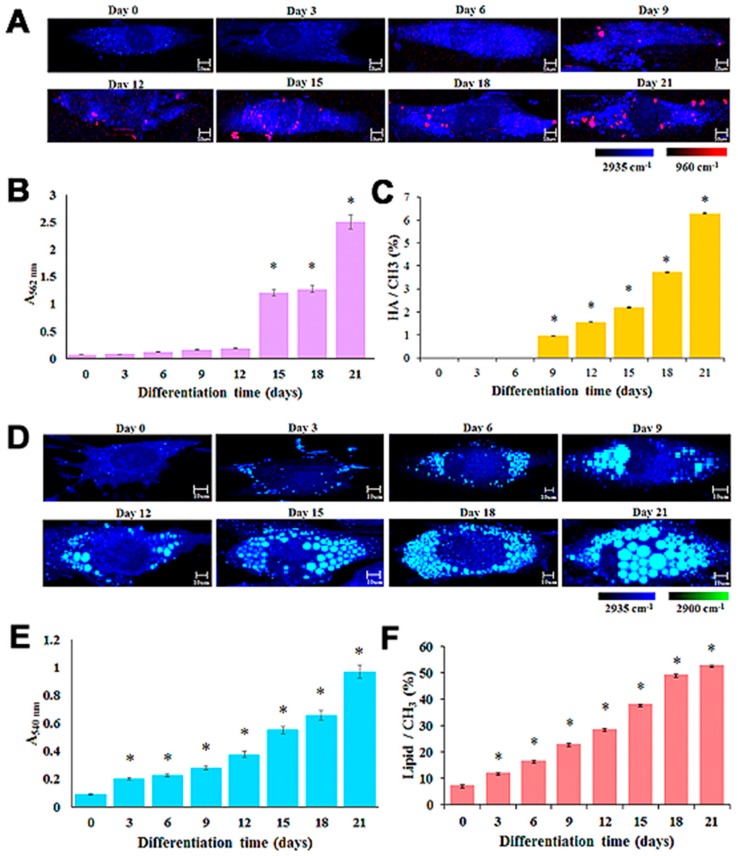
Figure 5.
Label-free monitoring of MSC differentiation into osteoblasts and adipocytes in a time-dependent manner: (A) Raman mapping of single live osteoblast using the peak at 960 cm−1 (referring to the presence of HA); (B) ARS quantification staining within an interval time of three days; (C) HA/CH3 ratio based on Raman mapping analysis; (D) Raman mapping of single live adipocyte using the lipid peak at 2,900 cm−1; (E) ORO quantification staining within an interval time of three days; and (F) lipid/CH3 ratio based on Raman mapping analysis. Reprinted with permission from [17]. Copyright 2018, Elsevier.

