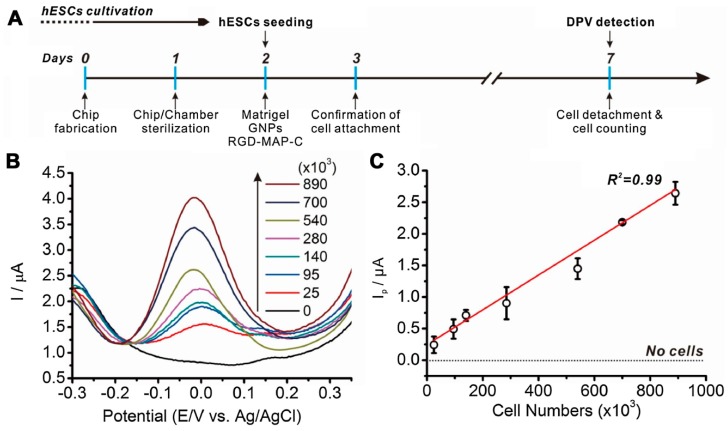
Figure 7.
Linear correlations between differential pulse voltammetry (DPV) signals and number of human embryonic stem cells (hESCs): (A) brief protocol for cell chip-based electrochemical detection of hESCs; (B) DPV signals with indicative number of hESCs, from 25,000 cells to 890,000 cells, presented as an XY graph; and (C) linear correlations (R2) between number of hESCs and the peak intensity (Ip) value calculated from the DPV signals. Reprinted with permission from [23]. Copyright 2018, Elsevier.

