Figure 1.
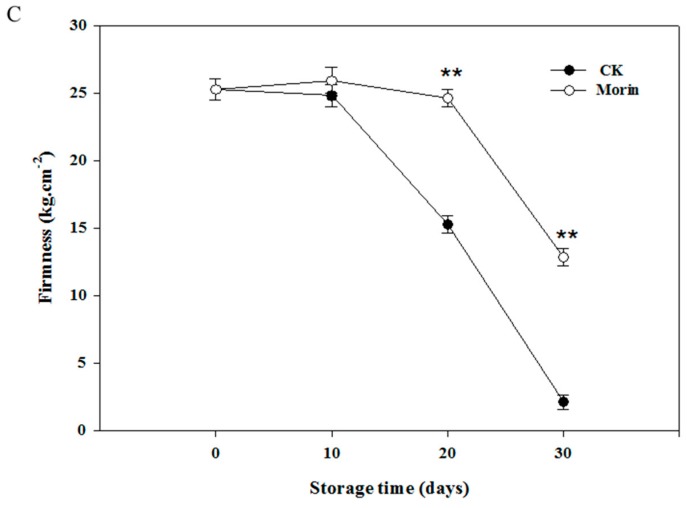
The changes of appearance (A); color (B); and firmness (C) of banana during storage. For (B,C): •, CK, control; ○, 0.1% morin-treated. Data were presented as the means ± standard errors. Asterisks represent the significant difference between the control and morin-treated groups at the same time (** p < 0.01).


