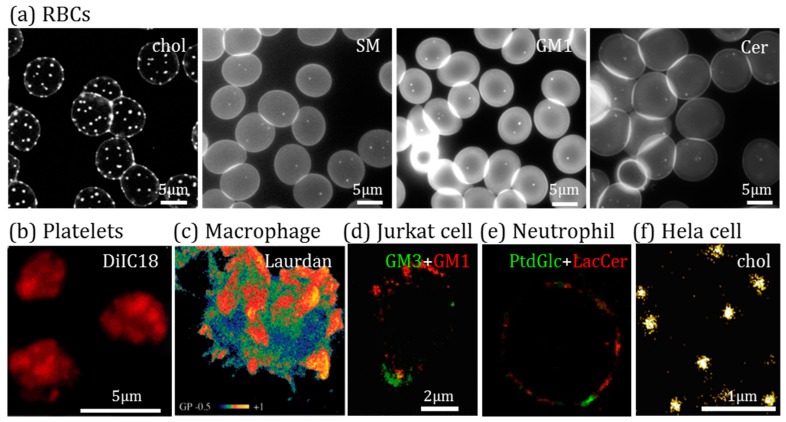
Figure 5.
Visualization of plasma membrane lipid domains. (a) RBCs labeled for chol with Theta-D4-mCherry or with boron-dipyrromethene-sphingomyelin (BODIPY-SM), -GM1 (BODIPY-GM1) or –ceramide (BODIPY-Cer) and analyzed by fluorescence or confocal microscopy. (b) Platelets labeled with DilC18 and analyzed by fluorescence microscopy. (c) Macrophage labeled with Laurdan and vizualized by two-photon microscopy. (d) Jurkat cell labeled for GM3 and GM1 using anti-GM3 serum and cholera toxin B subunit, respectively, and visualized by confocal imaging. (e) Human neutrophil stained for phosphatidylglucoside (PtdGlc) and lactosylceramide (LacCer) and examined by stimulated emission depletion microscopy (STED). (f) HeLa cell labeled for chol with Theta-D4-DRONPA and processed by photoactivated localization microscopy (PALM). Adapted from (a) [225]; (b) [229]; (c) [230]; (d) [231]; (e) [232]; (f) [233].

