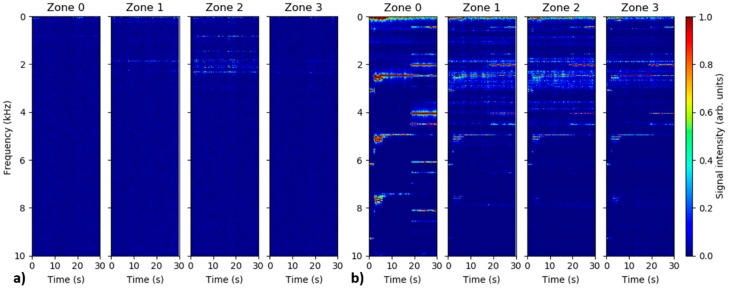
Figure 3.
Temporal evolution of position-averaged distributed acoustic sensing (DAS) signal spectra in the individual pipe zones recorded for 1 mm leak at 10 bars (a) and 8 mm leak at 20 bars (b). Note that amplitude of spectra for 1 mm leak at 10 bars are scaled by factor 5 relatively to the spectra for 8 mm leak at 20 bars.

