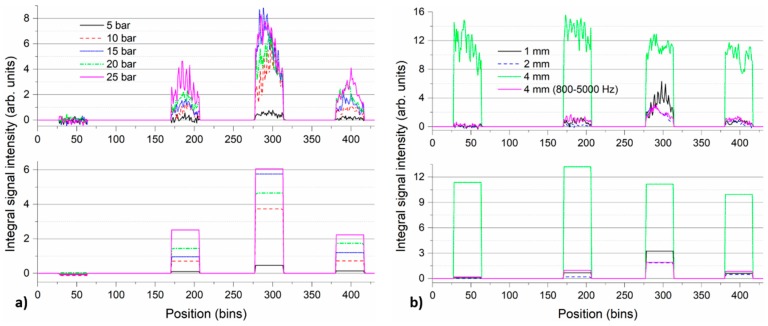
Figure 10.
Integral spectral intensity of the detected DAS signals along the fiber for the measurement series with 1 mm leak at different pressure levels (a) and for the measurement series at constant pressure level of 10 bars and different leak sizes (b). The time-averaged spectra of DAS signals from individual measurements were integrated in 500–5000 Hz range. Additional curve for 4 mm leak at 10 bars using spectral integration in 800–5000 Hz range is included in plot (b). Top-row graphs show spectrally-integrated signals for individual bins in the four pipe zones. Bottom-row graphs show corresponding zone-averaged signal integral spectral intensities.

