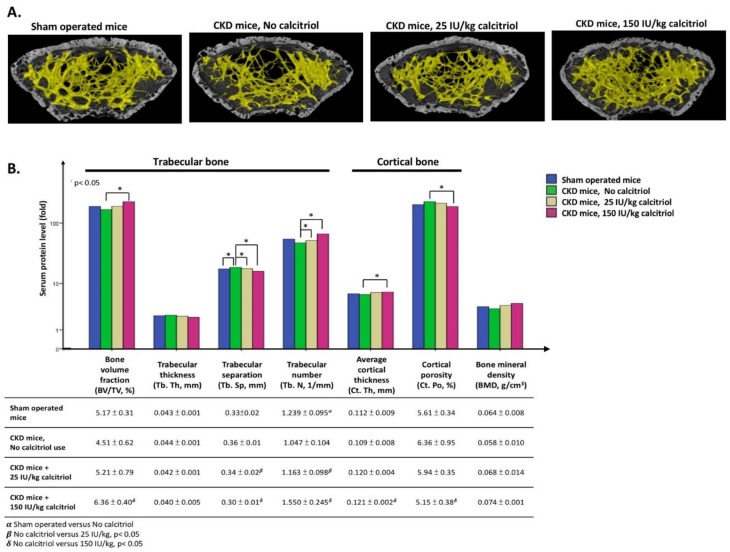
Figure 10.
Three-dimensional (3D) image obtained via Bruker micro-tomography. (A) Trabecular bone mass (yellow part) of femur bone was greater after calcitriol treatment. (B) The growth of trabecular and cortical bone all increased significantly, especially calcitriol dose of 150 IU/kg for one month. (Blue: Sham operated control; green: CKD mice, No calcitriol; yellow: CKD mice, 25 IU/kg calcitriol use; red: CKD mice, 150 IU/kg calcitriol use). All experiments in this figure use mice in the C57/Bl6 background. (* p < 0.05, n = 3).

