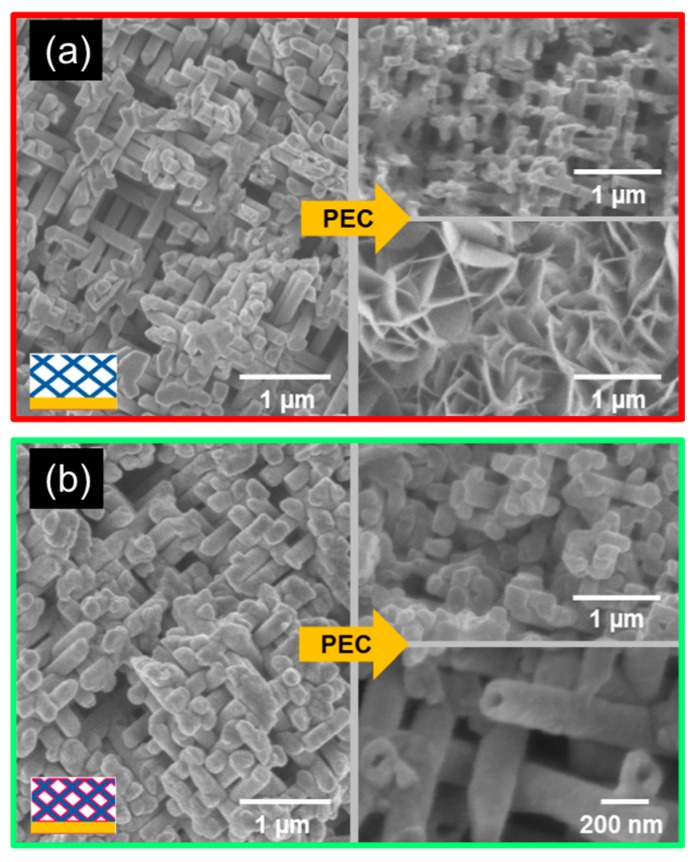
Figure 8.
SEM images of (a) ZnO nanowire network and (b) ZnO/TiO2 nanowire network taken before (left) and after (right) PEC measurements. The insets schematically display the cross-section of each sample, indicating the distribution of the various materials—namely, gold (yellow), ZnO (blue), and TiO2 (pink).

