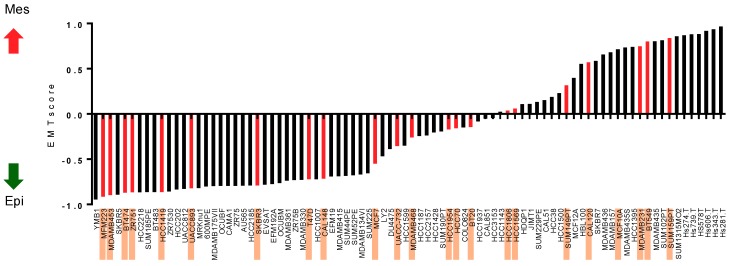
Figure 1.
The alignment of breast cancer cell lines across the epithelial–mesenchymal spectrum. Breast cancer cell lines are placed from the most epithelial (lowest EMT score; y-axis) to the most mesenchymal (highest EMT score) in the epithelial–mesenchymal spectrum. Breast cancer cell lines included for DNA methylation analysis in this study are highlighted and correspond to the red bars on the graph. The red and black arrows indicate increasing mesenchymal scores and increasing epithelial scores respectively.

