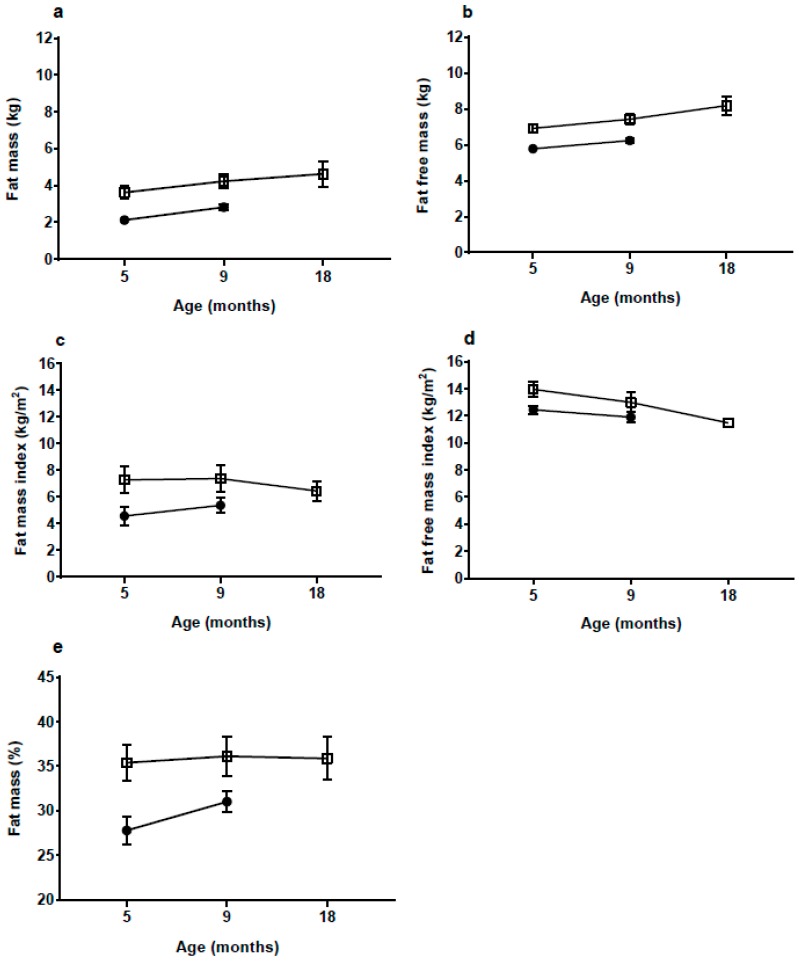
Figure 3.
(a) fat mass; (b) fat free mass; (c) fat mass index; (d) fat free mass index and (e) fat mass percentage at 5 months (mo) (high weight gain group (HW) n = 12; normal weight gain group (NW) n = 17), 9 mo (HW n = 12; NW n = 15) and 18 mo (HW n = 7) according to group presented as mean and 95% confidence interval. Data at 18 mo were not available for the NW group. Bioimpedance values based on Lingwood equations [21]. HW = □ NW = ●

