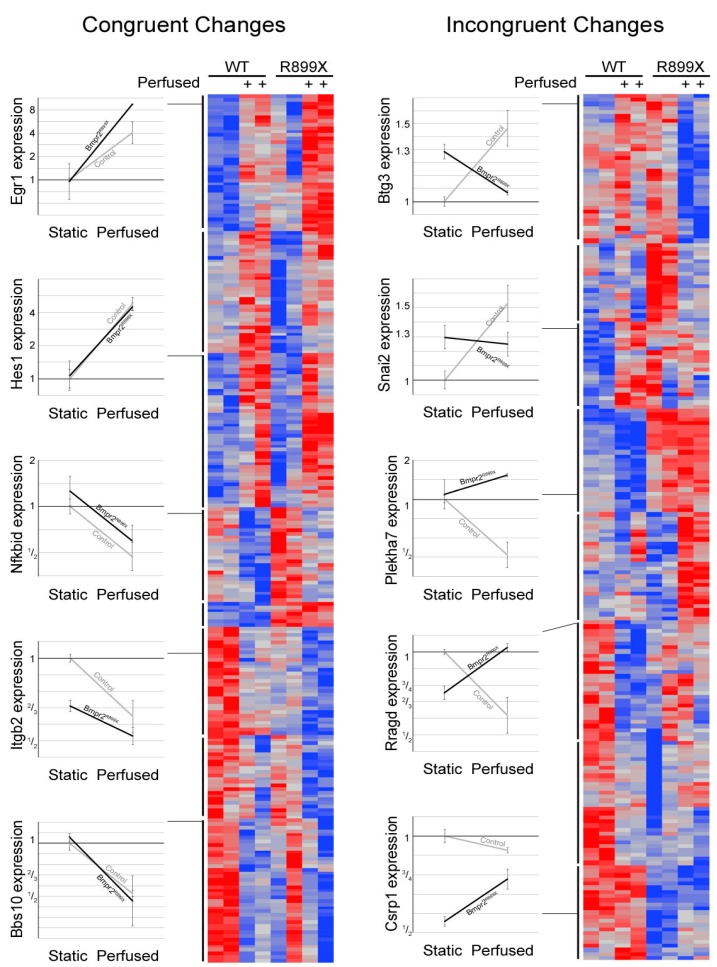
Figure 3.
Congruent and incongruent heat map depiction of gene expression changes. Heat maps were separated by cell genotype (WT and Bmpr2R899X) with flow (+) or without flow. Representative genes and corresponding expression changes were selected to illustrate change in expression seen within the congruent and incongruent maps. Congruent genes had similar directional changes to flow but were offset by the magnitude of expression. Incongruent genes had opposite directional responses to flow that result in different magnitude changes. The inclusion of flow led to notable gene expression changes in both the R899X and WT endothelial cell. Notable changes in gene expression were seen between the cell’s genotype and flow conditions.

