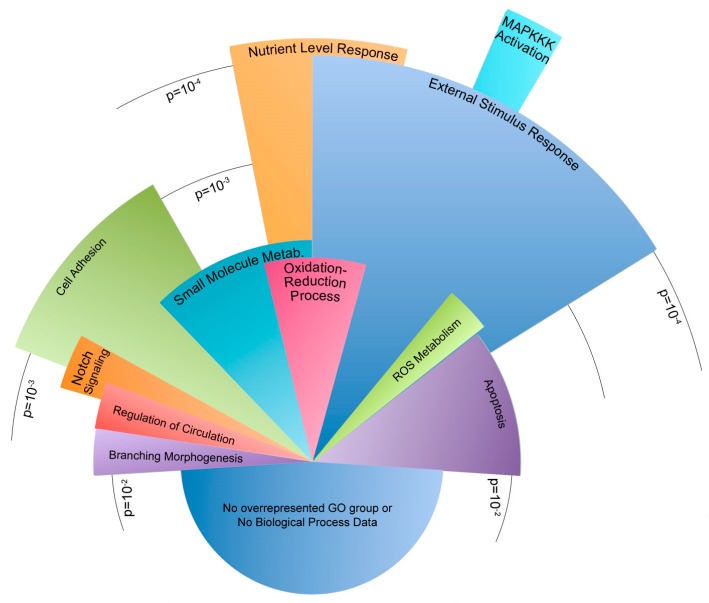
Figure 5.
Incongruent genes dysregulated in Bmpr2R899X endothelial cells after 24 h of perfusion. Pie chart shows relative number of genes in statistically dysregulated gene ontology groups. Arc length of the gene ontology groups corresponds to the number of genes present in each group. Radius length corresponds to significance, where the longest categories were significantly dysregulated at ~p < 1 × 10⁻⁵ and the shortest categories were dysregulated at p < 1 × 10⁻². Please see the Supplementary Materials for a table of these findings.

