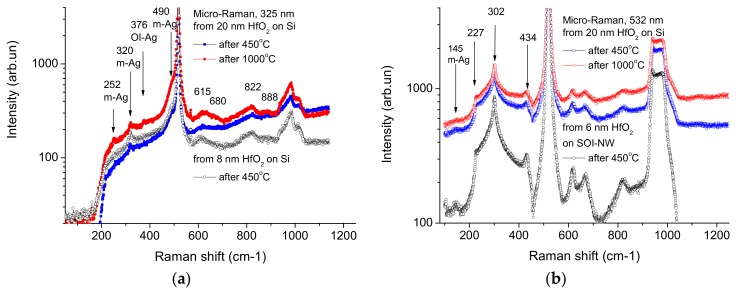
Figure 2.
Typical micro-Raman spectra excited by laser radiation in ultraviolet (UV) (325 nm) (a) and visible (532 nm) (b) ranges on silicon wafers and SOI-NW chips. Experiment conditions: annealing temperature 450 °C (black and blue lines) and 1000 °C (red lines), HfO2 layer thickness 20 nm (red and blue lines) and <10 nm (black lines). Arrows indicate spectrum lines corresponding to monoclinic (m) and orthorhombic (OI) phase phonons of HfO2 (a) and acoustic phonons of Si (b) according to [35,36,37]).

