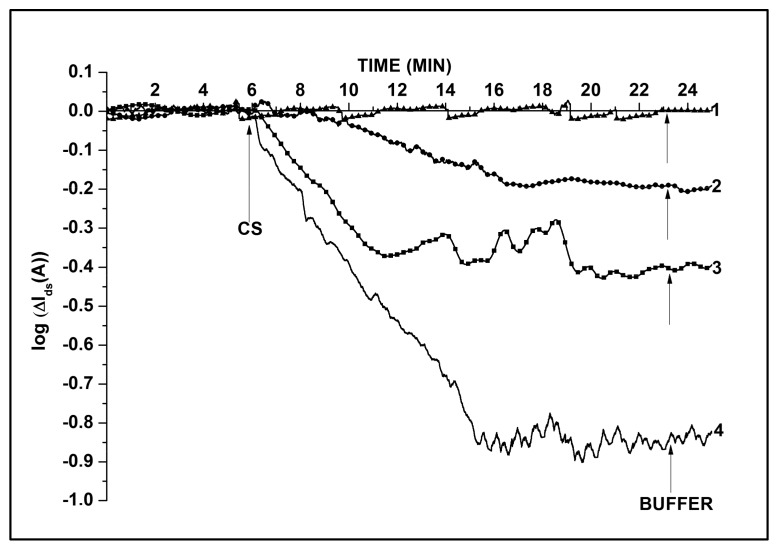
Figure 5.
Typical ΔIds(t) dependencies obtained upon detection of oDVA in buffer using (h-k)-SOI-NW sensors with immobilized oDNA probes. Experimental conditions: 1 mM potassium phosphate buffer (pH 7.4), Vg = −50 V, Vd = −0.2) V, total volume of solution in the cell 450 μL. Final concentrations of target oDVA in the measuring cell were 3.3 × 10⁻¹⁷ M (curve 1), 3.3 × 10⁻¹⁶ M (curve 2), 3.3 × 10⁻¹⁵ M (curve 3), 3.3 × 10⁻¹⁴ M (curve 4). Arrows indicate the addition of target oDNA solution (CS) and wash with buffer.

