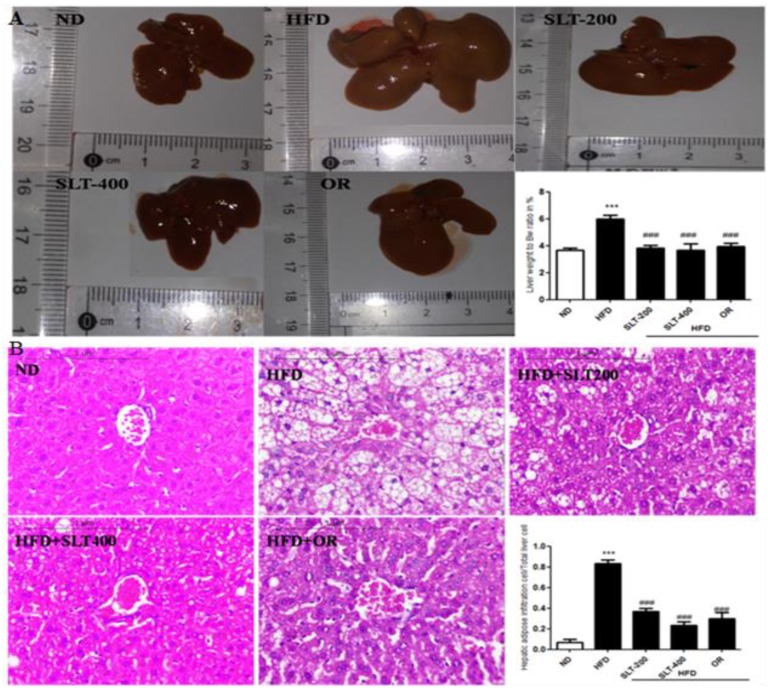
Figure 4.
SLT supplementation preserved normal liver in HFD C57BL/6 mice. (A) Representative liver images and liver weight-to-BW ratio; (B) Representative images of liver tissue, Hematoxylin–Eosin (HE) staining, and quantification of fatty hepatic cells. Data are presented as mean ± SEM (n = 3–6). One-way analysis of variance (ANOVA) followed by Tukey’s test were used to compare all pairs of columns. ND: normal diet; HFD: high fat diet; SLT-200, SLT-400: animals received intragastric supplements of SLT every day at a dosage of 200 and 400 mg/kg body weight (BW), respectively; OR: intragastric administration of Orlistat at 10 mg/kg BW/day. *** p < 0.001 versus ND, and ### p < 0.001 versus HFD.

