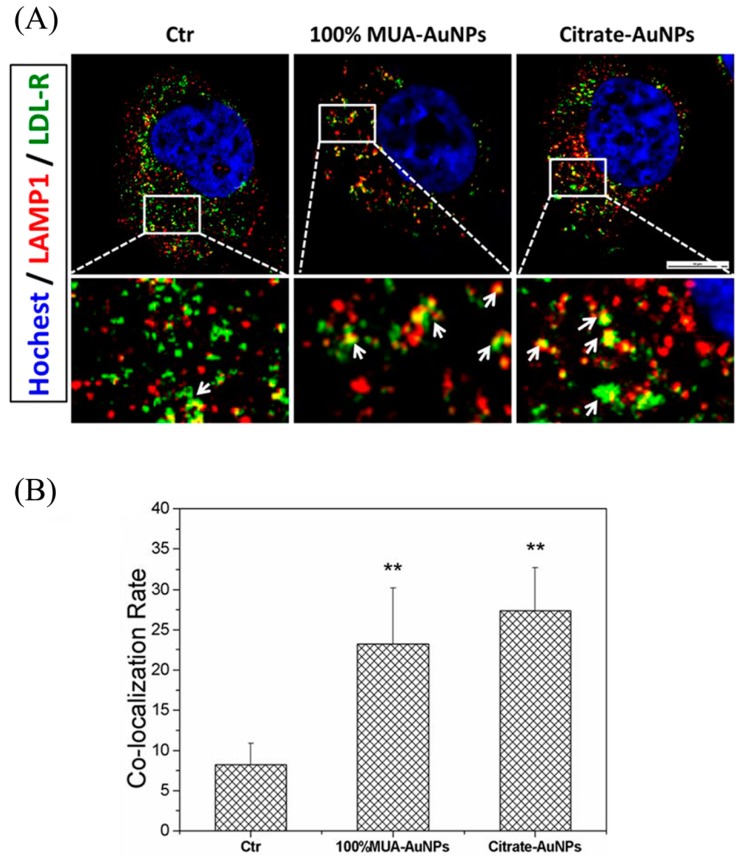
Figure 6.
Retained LDL-R in early endosomes (EEs) transported to the lysosome for degradation. Fluorescence images were captured using LSCM (A), and quantitative data were analyzed using NIS-Elements, white arrows indicate the colocalization area between EEs and LDL-R. (B). The colocalization ratios were presented as the means ± SEM from three independent experiments, and more than 30 cells were selected for each experiment. ** p < 0.01 indicates significant differences in the treated cells compared with the control group. Bar = 10 μm.

