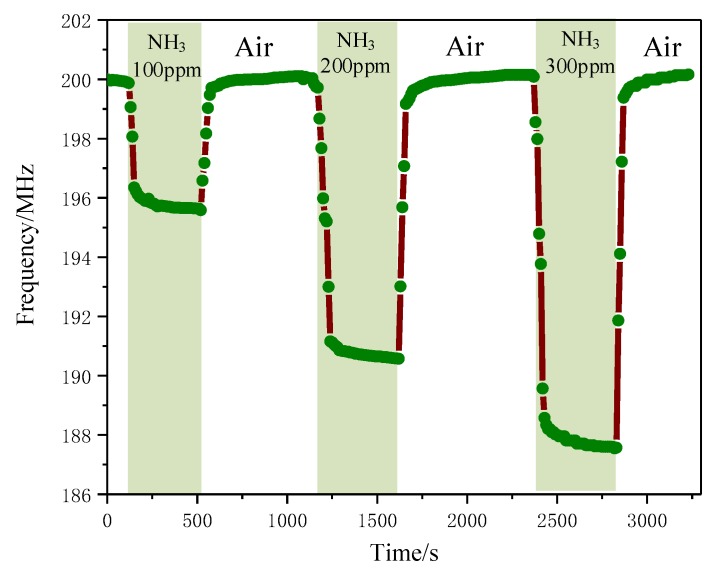
Figure 12.
Response and recovery time curve at different concentrations: It can be seen that the variation of f0 is 4.352 MHz, 9.235 MHz and 12.070 MHz, respectively; the sensitivity of gas sensor is about 0.04 MHz/ppm under the concentration of 300 ppm. With a low concentration, the variation of resonant frequency is relatively large.

