Figure 6.
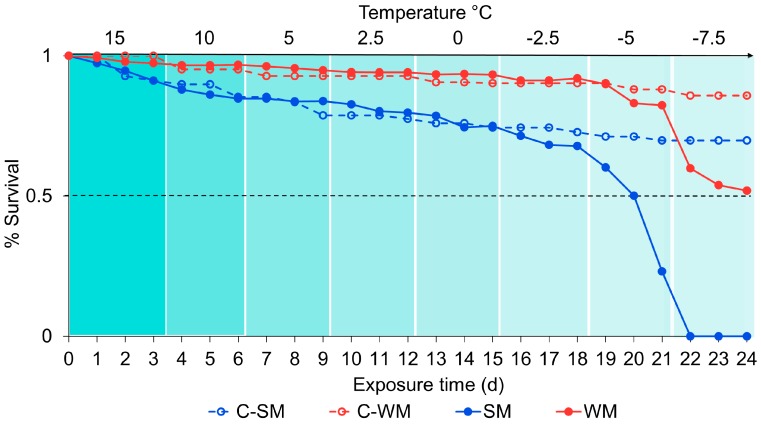
The effect of gradual cooling on mean survivorship in adult SM and WM D. suzukii. Survivorship was observed (y-axis) as the temperature (x-axis TOP) decreased over time (x-axis BOTTOM) in 3 days intervals. Color bands indicate differences in temperature, with lighter bands being cooler than darker bands. The solid dots and lines indicate percent survival per replicate among flies in the gradual cooling treatments (SM and WM). Open dots and dashed lines indicate flies in the control treatments (C-SM and C-WM) which were kept at 15 °C for the duration of the study.

