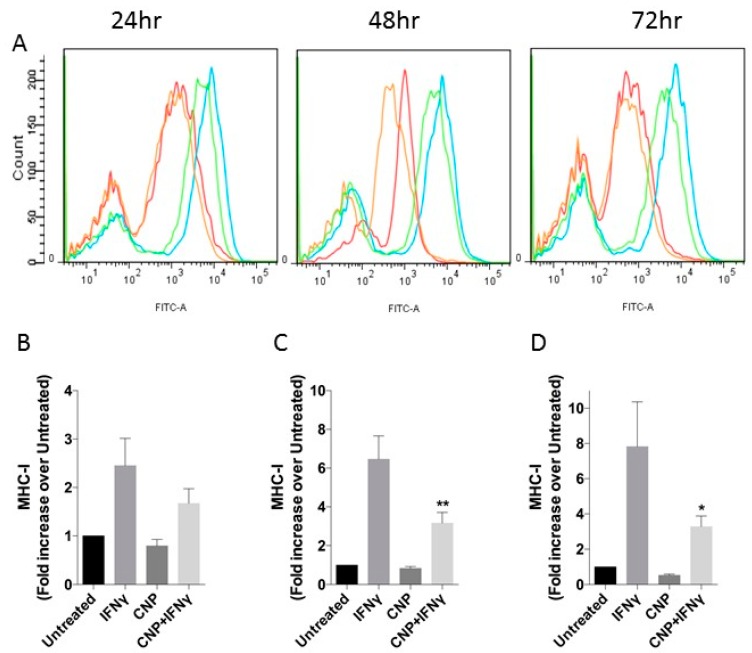
Figure 2.
MHC class I expression in HUVEC after incubation with IFN-γ alone or in combinations with CNP for up to 72 h. (A) Representative flow cytometry histograms for MHC-I after incubation of HUVEC alone (Red) or with IFN-γ (Blue), CNP (Orange) or IFN-γ and CNP (Green) for the indicated times. (B–D) Mean Fluorescence Intensity (expressed as fold increase over MFI of untreated cells, which ranged from 2079 to 6549; mean ± SEM) for MHC-I on untreated HUVEC or after 24 h (B), 48 h (C) or 72 h (D) treatment with IFN-γ alone or in combination with CNP; n = 3 HUVEC isolates (* p < 0.05, ** p < 0.01, significantly different from IFN-γ alone).

