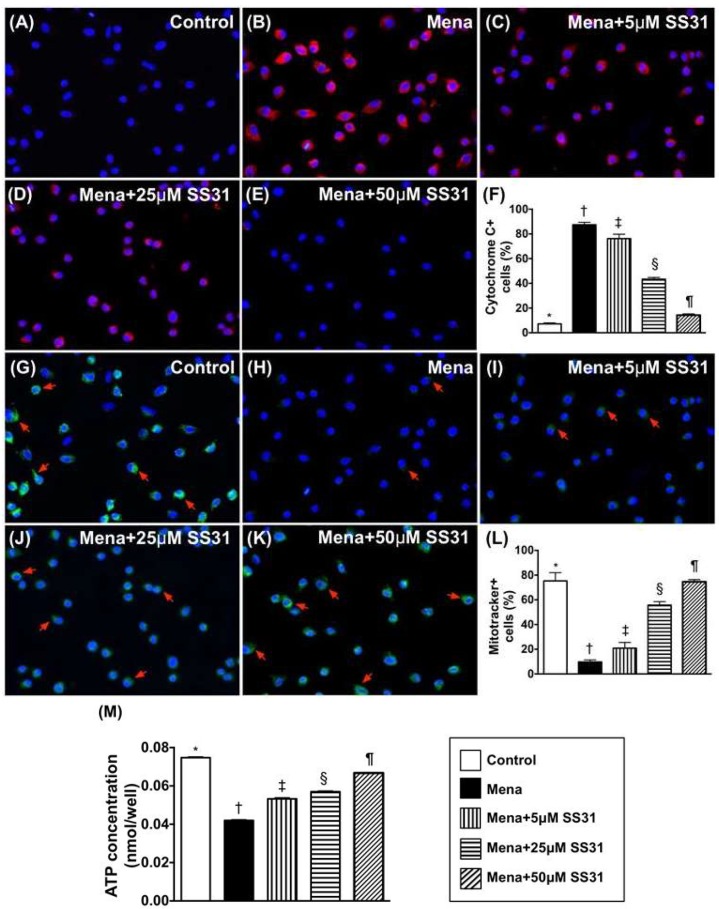
Figure 2.
SS31 protects mitochondria from oxidative damage. (A–E) Illustrating the IF microscopic finding (400×) of cytosolic cytochrome C (cyt-Cyto C) staining (red color) (i.e., an indicator of mitochondrial damage). The ultrastructural cytosolic cytochrome C in H9C2 cells was notably increased by menadione treatment when compared to the normal control that was notably preserved after SS31 treatment. Blue color indicates nuclei stained by DAPI. (F) The analytical result of number of cyt-Cyto C+ cells * vs. other groups with different symbols (†, ‡, §, ¶), p < 0.0001. (G–K) Illustrating IF microscopic finding (400×) of mitotracker-positively stained cells (i.e., endogenous mitochondria) (green color) (red arrows). (L) The analytic result of number of mitotracker+ cells * vs. other groups with different symbols (†, ‡, §, ¶), p < 0.0001. (M) ATP concentration (i.e., measured by ELISA kit) of H9C2 cells * vs. other groups with different symbols (†, ‡, §, ¶), p < 0.0001. All statistical analyses were performed by one-way ANOVA and was followed by a Bonferroni multiple comparison post hoc test (n = 6 for each group). Symbols (*, †, ‡, §, ¶) indicate significance at the 0.05 level.

