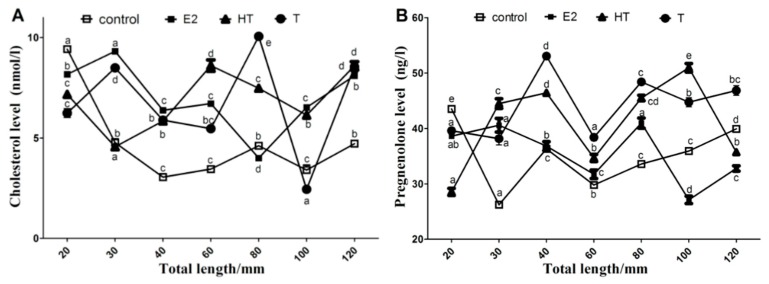
Figure 8.
Cholesterol (A) and pregnenolone levels (B) in the flounder gonad during gonad differentiation period. Data are means ± S.E.M. of three independent samples. Different lowercase letters (a, b, c, d and e) indicate a significant difference in values among sampling points in each group (p < 0.05). Control, control group; E2, estradiol treatment group; HT, high temperature treatment group; T, testosterone treatment group.

