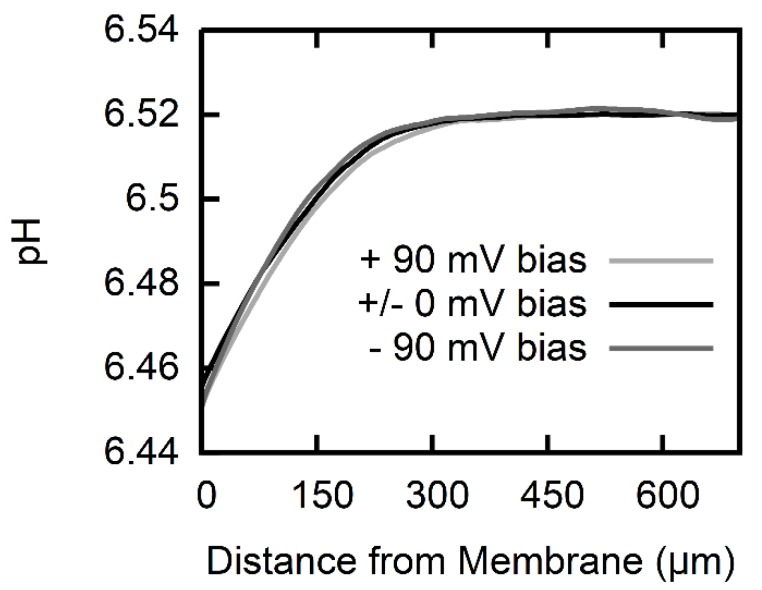
Figure 3.
pH profiles at a constant AscH gradient (trace for 688 mM Na-l-ascorbate in Figure 2) under varying transmembrane voltage bias (black: no bias, light gray: +90 mV, dark gray: −90 mV). The pH profiles are independent of the applied transmembrane voltage within the borders of resolution which attributes the pH profiles to the permeation of a neutral species.

