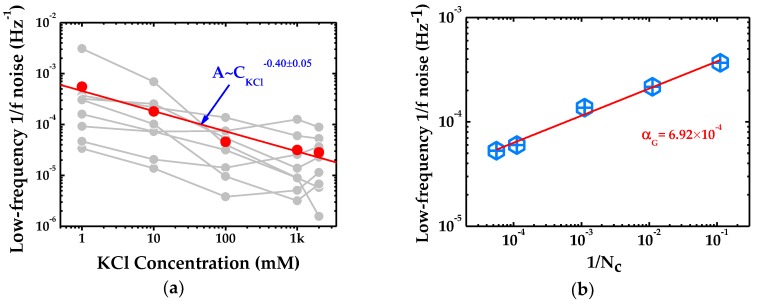
Figure 3.
Verification of Hooge’s relation in single-layer graphene based nanopore system: (a) Dependency of low-frequency noise on KCl concentration. The red points are the average of eight pores at varied KCl concentration. Likewise, the red curve is the linear fitting of the mean values at different KCl concentration; and (b) the relationship between low-frequency noise and inverse number of charge carriers. The fit line determines the noise coefficient () in the graphene nanopore of No. 2.

