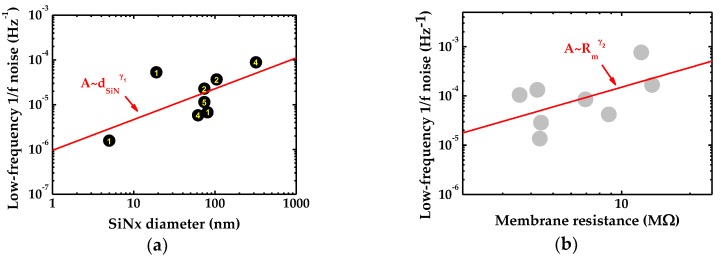
Figure 4.
(a) Low-frequency noise power plotted against the underlying SiNx diameter. The yellow number in the center of the points represent the pore size of each graphene nanopore; and (b) the noise in the low-frequency range versus membrane resistance. The red solid line fits to the resistance of eight graphene nanopores.

