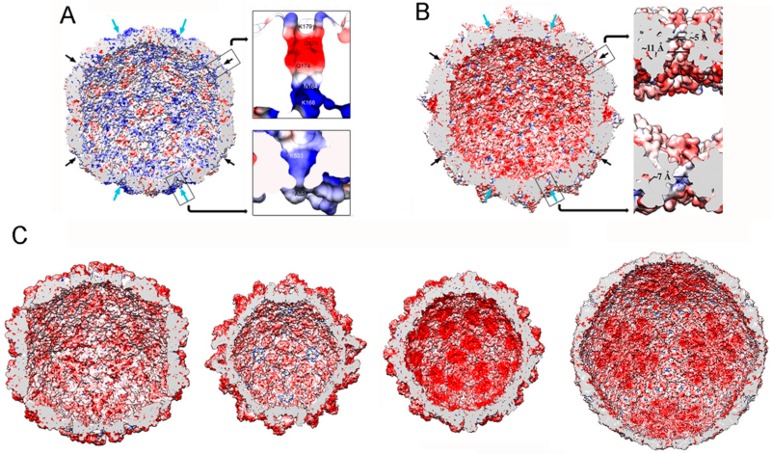
Figure 7.

dsRNA virus T = 1 capsid inner surfaces with electrostatic potentials. (A) PcV and (B) RnQV1 capsid inner surfaces viewed along a two-fold axis of icosahedral symmetry. The inner surface charge representations of these capsids show the distribution of negative (red) and positive (blue) charges. Note the numerous electropositive areas in PcV. Arrows indicate the capsid pores at the five-fold (black) and three-fold (blue) axes. Boxes: magnified views of the five- (top) and three-fold (bottom) pores showing charge distribution on the channel walls. (C) T = 1 capsids of ScV-L-A, PsV-Fe, rabbit picobirnavirus, and rotavirus (from left to right), viewed along a two-fold axis of icosahedral symmetry. dsRNA and packaged proteins (such as RNA polymerases) were removed computationally.
