Figure 5.
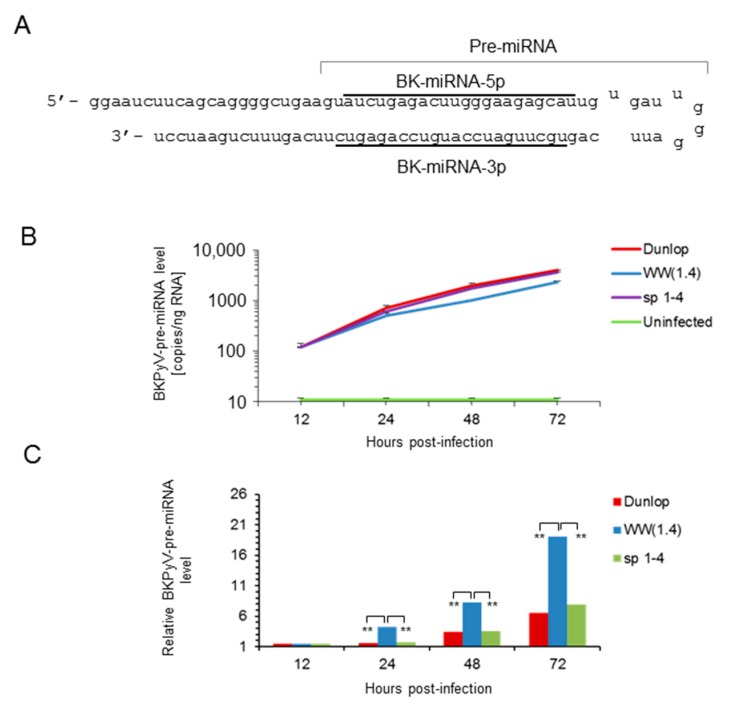
Time course of BKPyV pre-miRNA expression in infected RPTECs. (A) Schematic representation of the BKPyV pre-miRNA hairpin and the corresponding BKPyV-miRNA-5p and miRNA-3p sequence (underlined). (B) Time course of BKPyV pre-miRNA expression levels after infection of RPTECs with the indicated strains. Mean values ± standard deviation of 3 independent experiments are shown. (C) Comparison of relative BKPyV pre-miRNA expression levels per BKPyV genome copy (template) in cells. Results are expressed as BKPyV-miRNA levels normalized to BKPyV genome copy number, archetype WW(1.4) values at 12 h post-infection are set to 1 (-fold; ** p < 0.01).

