Figure 4.
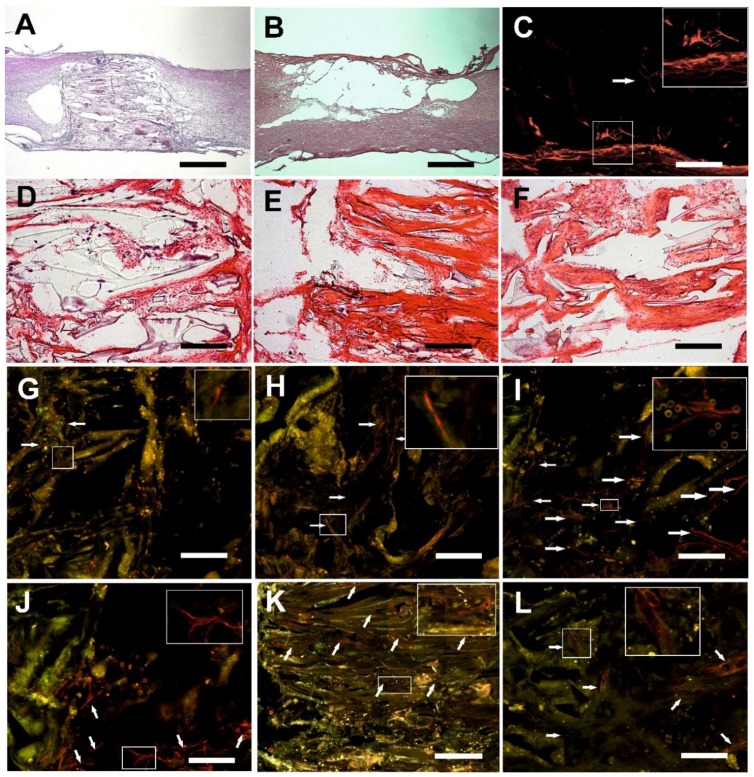
The mosaic presents various aspect of tissue ingrowth within the pores of the three methacrylate hydrogels. (A) HEMA-Fn sufficiently bridged the hemisection cavity. In some cases there were minor cavities on the border. The HEMA-Fn scaffold serves as a representative sample for all three methacrylate hydrogels (HE staining, scale bar = 1 mm). (B) The lesion resulted in a large pseudocystic cavity in the control group (HE staining, scale bar = 1 mm). (C) Subtle astrogliosis was present within the spinal cord tissue neighboring the HPMA scaffold and a few islets of astrocytes also infiltrated its peripheral part (white arrow, GFAP-Cy3 staining, scale bar = 100 µm). (D) Sparse connective tissue elements were found in the plain HEMA scaffold; there was a more dense infiltration within the pores of the HEMA-Fn (E) and the HPMA hydrogel (F) HE staining, scale bar = 100 µm. (G) No axonal sprouts were present in the HEMA scaffold, however, some axons (white arrows) reached the border zone of the spinal cord (NF160-g594 staining, scale bar = 25 µm). (H) A small number of sprouts (white arrows) were present within the HEMA-Fn scaffold (NF160-g594 staining, scale bar = 25 µm); significantly higher number of sprouts was present (white arrows) within the central parts (I) as well as the periphery (J) of the HPMA hydrogels (NF160-g594 staining, scale bar = 25 µm). (K) Blood vessels (white arrows) grew abundantly within the pores of all three hydrogels especially the HEMA-Fn scaffold, as seen in this image (RECA-g488 staining, scale bar = 50 µm). (L) A detailed view of the blood vessels within the HEMA-Fn scaffold (RECA-g488 staining, scale bar = 25 µm). Insert boxes depict the typical elements described in each image of the mosaic (enlarged twice to the original size).

