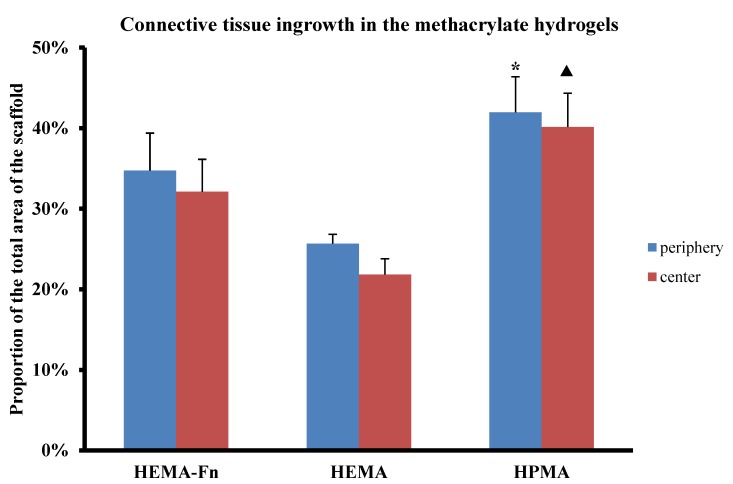
Figure 5.
Comparison of connective tissue ingrowth within the three hydrogels. The graph presents the percentage of HE-positively stained tissue within the whole area of the peripheral (blue bars) and central (red bars) regions of the hydrogel. The HPMA scaffold showed higher connective tissue ingrowth within the periphery (* p < 0.05) as well as the central part (▲ p < 0.05) of the HEMA scaffold. Data shown as mean, and the error bars represent SEM. For statistical analysis, a one-way ANOVA test was used.

