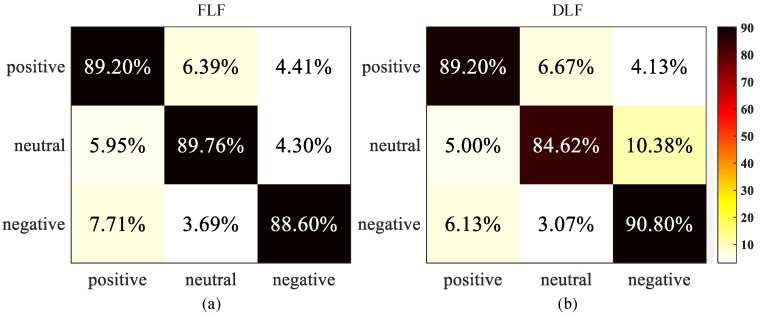
Figure 12.
Confusion matrices of two fusion strategies. (a) The FLF confusion matrix; (b) The DLF confusion matrix. Each row of the matrix represents the actual class and each column indicates the predicted class. The element is the percentage of samples in category i that is classified as category j.

