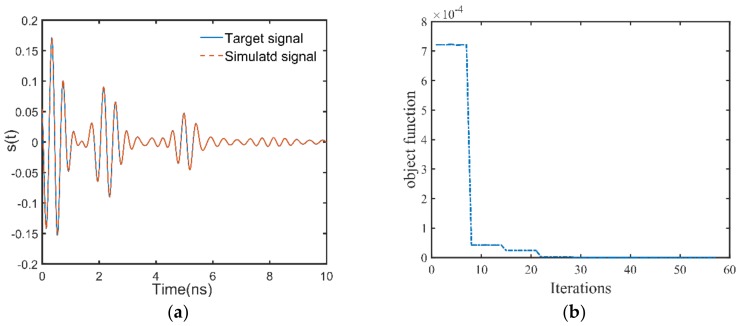
Figure 6.
(a) Time domain waveforms of the GPR data simulated by the inversion results and the target signal. Good agreement can be seen between them. (b) The trajectory of the objective function during the inversion process. It can be seen that the objective function is only calculated by 30 times to find the global optimal solution.

