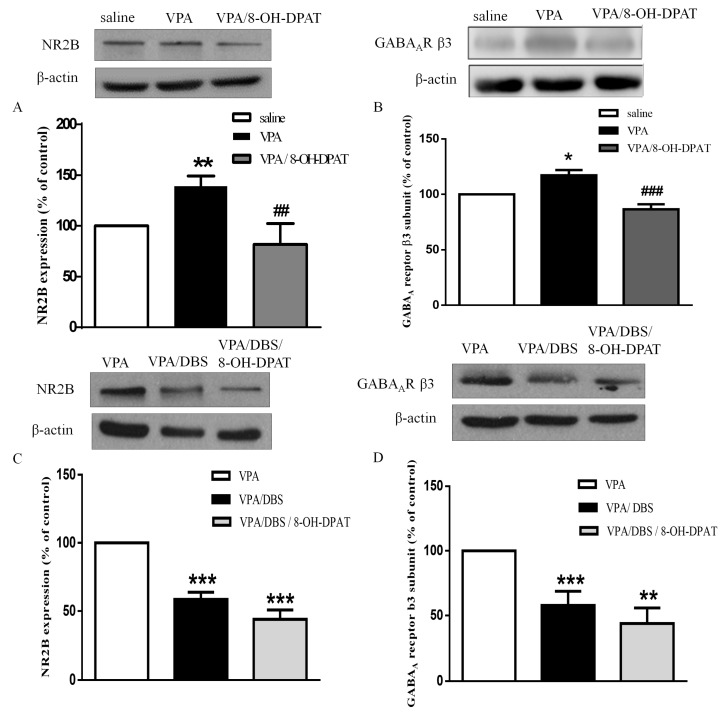
Figure 5.
DBS and 8-OH-DPAT treatment reversed the increased expressions of NMDAR subunit NR2B and the GABAAR β3 subunit in the VPA-exposed offspring. (A) Representative blots and quantification showing the synapse NMDAR subunit NR2B expression after 8-OH-DPAT treatment in the VPA-exposed offspring. Sample sizes (n): Saline n = 12, VPA n = 9, VPA/8-OH-DPAT n = 5; (B) representative blots and quantification showing the synapse GABAAR β3 subunit expression after 8-OH-DPAT treatment in the VPA-exposed offspring. Sample sizes (n): Saline n = 4, VPA n = 4, VPA/8-OH-DPAT n = 4; (C) immunoblots and quantification showing the synapse NMDAR subunit NR2B expression after seven days of DBS and after three days of DBS combined with 8-OH-DPAT treatments in the VPA-exposed offspring. Sample sizes (n): VPA n = 14, VPA/DBS n = 12, VPA/DBS/8-OH-DPAT n = 12; (D) western blotting showing the synapse GABAAR β3 subunit expression after seven days of DBS and after three days of DBS combined with 8-OH-DPAT treatment in the VPA-exposed offspring. Sample sizes (n): VPA n = 8, VPA/DBS n = 6, VPA/DBS/8-OH-DPAT n = 6. * p < 0.05 vs. saline/vehicle; ** p < 0.01 vs. saline/vehicle; * p < 0.05 vs. saline; ** p < 0.01 vs. saline; ** p < 0.01 vs. VPA; *** p < 0.001 vs. VPA; ## p < 0.01 vs. VPA; ### p < 0.001 vs. VPA.

