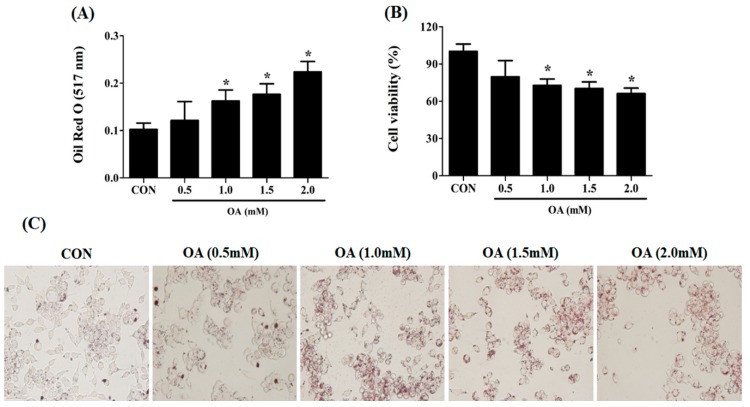
Figure 1.
Induction of cellular steatosis in HepG2 cells. An appropriate concentration of OA for inducing cellular steatosis was determined using ORO staining and cell counting assay (CCK-8). Lipid content of the cells was measured at 517 nm after ORO staining (A). The viability of the OA-treated cells was determined at various concentrations of OA solution using the CCK-8 kit (B). The morphological distribution of lipid droplets within the cells was observed using ORO staining (C). Data are represented as mean ± standard deviation (SD) (n = 4) values. Asterisk (*) indicates a significant difference compared with the control (p < 0.05).

