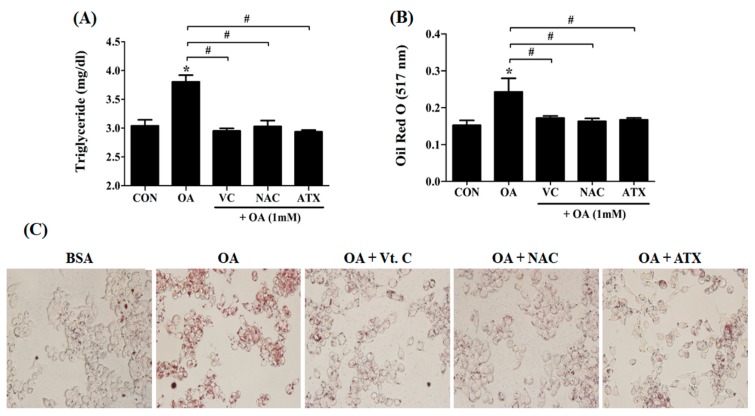
Figure 2.
Intracellular triglyceride (TG) levels and lipid synthesis after antioxidant treatment in the OA-treated cells. When 1 mM OA solution and 10 μM antioxidants were added, the TG concentration (A) and lipid contents (B) within the cells were examined using the TG assay kit and ORO staining method. At this time, lipid droplets stained with ORO solution appear in red color (C). Data are represented as mean ± SD values (n = 4). Asterisk (*) indicates a significant difference compared to control (p < 0.05). Sharp (#) indicates a significant difference among the experimental groups (p < 0.05).

