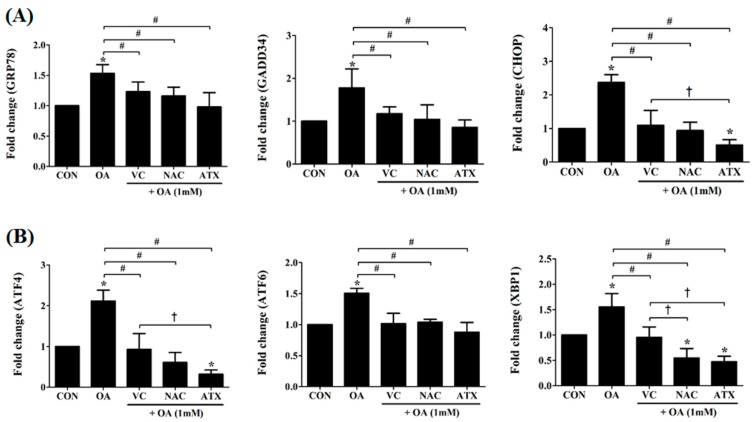
Figure 4.
Changes in the ER stress-related genes after antioxidant treatments in the OA-treated cells. The expression levels of GRP78, GADD34, CHOP, ATF4, ATF6, and XBP1, major effectors in the cellular process of cell death due to ER stress were measured using real-time PCR. Data are represented as fold changes compared to the mRNA level in control and are shown as mean ± SD values (n = 6). Asterisk (*) indicates a significant difference compared with the control (p < 0.05). Sharp (#) indicates a significant difference among the experimental groups (p < 0.05). Dagger (†) indicates a significant difference compared to each other among the antioxidants, VC, NAC, and ATX, using one-way ANOVA (p < 0.05).

