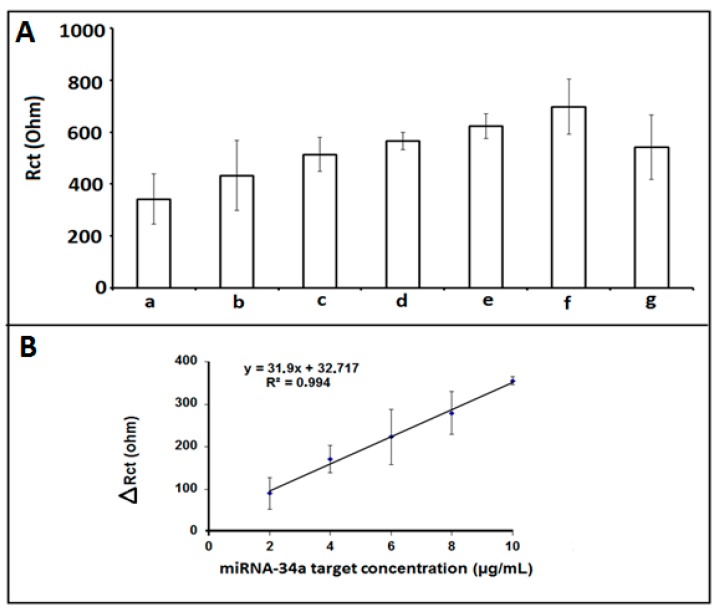
Figure 5.
(A) Histograms representing the Rct values obtained by (a) 1 µg/mL miRNA-34a DNA probe, after hybridization between 1 µg/mL miRNA-34a DNA probe and different miRNA-34a RNA target concentrations (b) 2 µg/mL, (c) 4 µg/mL, (d) 6 µg/mL, (e) 8 µg/mL, (f) 10 µg/mL (g) 12 µg/mL. (B) The calibration graph obtained from Rct values measured in the presence of different concentration of miRNA-34a target, ranging 2–10 µg/mL.

