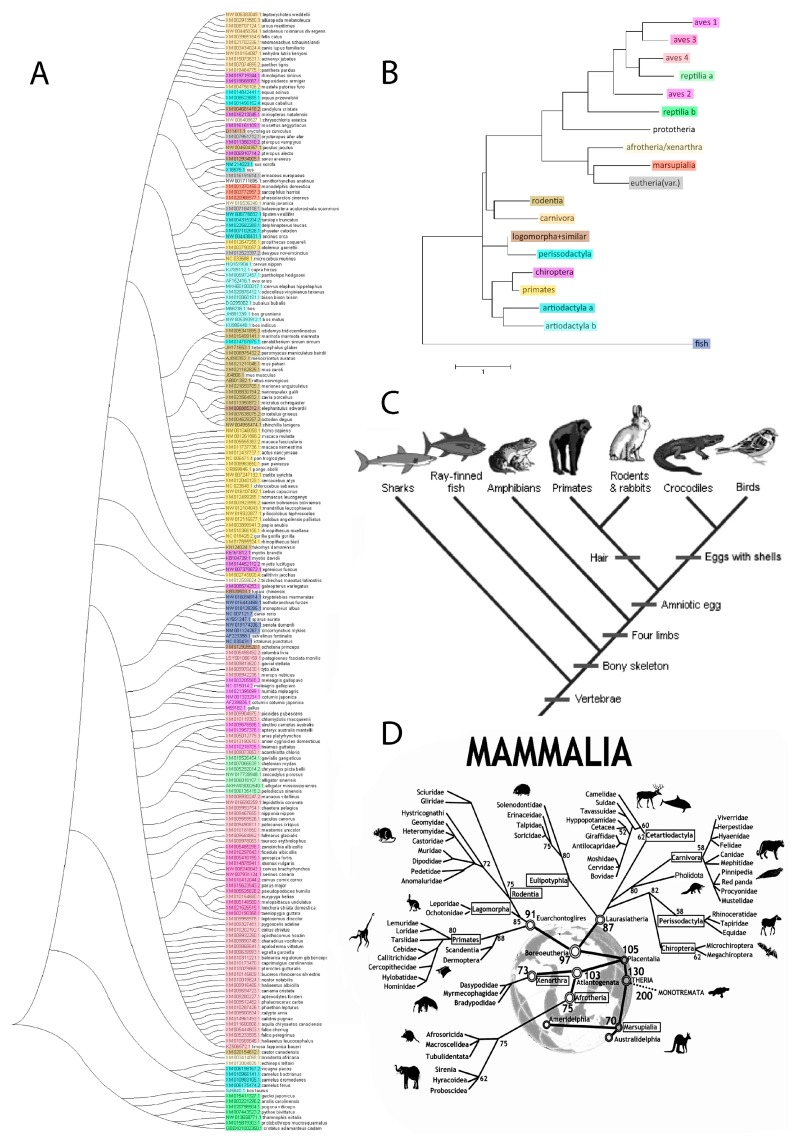
Figure 5.
Phylogenetic tree analysis of osteopontin. (A) Individual osteopontin sequences. The color coding reflects the taxonomic affiliation as displayed in (B). The tree with the highest log likelihood (−1039.72) is shown. The tree is drawn to scale, with branch lengths measured in the number of substitutions per site. The analysis involved 202 amino acid sequences. All positions containing gaps and missing data were eliminated. There were a total of 17 positions in the final dataset. (B) Canonical osteopontin sequences. The tree with the highest log likelihood (−7192.43) is shown. The analysis involved 19 amino acid sequences. All positions containing gaps and missing data were eliminated. There were a total of 156 positions in the final dataset. (reptilia A = Crocodilia, Testudines; reptilia B = Squamata; artiodactyla a = Camelidae, Suidae, Celaceae; artiodactyla b = Cervidae, Bovidae). (C) Evolutionary relationships of major vertebrate groups as a reference point. Adopted from the University of California Museum of Paleontology’s Understanding Evolution (https://evolution.berkeley.edu/evolibrary/search/imagedetail.php?id=251&topic_id=&keywords=phylogeny). (D) An evolutionary tree of Mammals as a reference point. The tree depicts historical divergence relationships among the living orders of Mammals. The phylogenetic hierarchy is a consensus view of several decades of molecular genetic, morphological and fossil inference. Double rings indicate mammalian supertaxa, numbers indicate the possible time of divergences [23]. This file has been reproduced from https://commons.wikimedia.org/wiki/File:An_evolutionary_tree_of_mammals.jpeg under the Creative Commons Attribution 2.0 Generic license.

