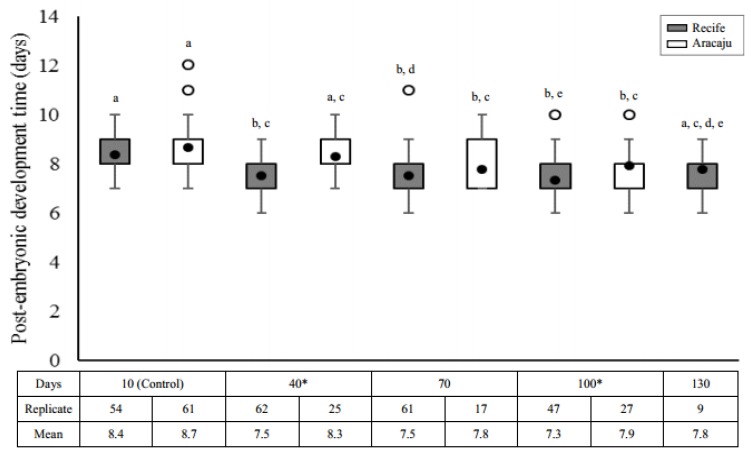
Figure 3.
Post-embryonic development time (days) for immature Aedes aegypti obtained from eggs with different quiescence periods in two mosquitoes populations—Recife (gray) and Aracaju (white). Replicates represent the number of larvae obtained in the viability tests (approximately 10% of total hatchling). Values are represented as average post-embryonic development time (closed circle); the size of the boxes indicates the distance between the first (lower) and third (upper) quartiles, while the central mark among them shows the median; the bars indicates variability outside quartiles and outliers are plotted with empty circles. The letters indicate comparisons between the different quiescent periods within each population (Kruskal–Wallis with Student–Newman–Keuls test a posteriori). Different letters indicate significant differences at p ≤ 0.05. Asterisks indicate significative difference interpopulational for comparisons of values of the same period of quiescence (Mann–Whitney test, p ≤ 0.05).

