Table 1.
Structural Clusters and pIC50 Values for HCT116 within the Clusters.
| Clusters 1 | Training Set 2 | Test Set 2 | Average/Maximum pIC50 3 |
|---|---|---|---|
I—ChEMBL1078221
|
650 | 129 | 5.24/11.00 |
II—ChEMBL1078389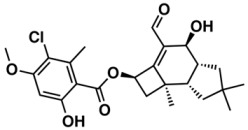
|
569 | 135 | 5.43/9.52 |
III—ChEMBL148968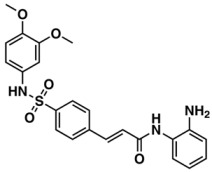
|
438 | 105 | 5.42/9.60 |
IV—ChEMBL116081
|
713 | 200 | 5.83/11.51 |
V—ChEMBL1083086
|
885 | 208 | 5.32/9.26 |
VI—ChEMBL104408
|
405 | 119 | 5.80/9.31 |
VII—ChEMBL1090871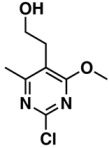
|
661 | 159 | 5.39/12.00 |
VIII—ChEMBL116614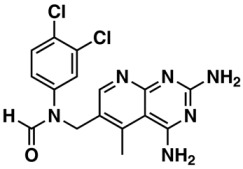
|
626 | 152 | 5.76/9.24 |
IX—ChEMBL1078573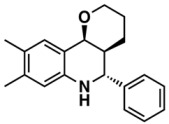
|
513 | 125 | 5.74/10.35 |
X—ChEMBL1830679
|
415 | 132 | 5.77/9.05 |
1 Cluster number and chemical structure of the cluster centroid; 2 Number of molecules; 3 Within the cluster for the training set.
