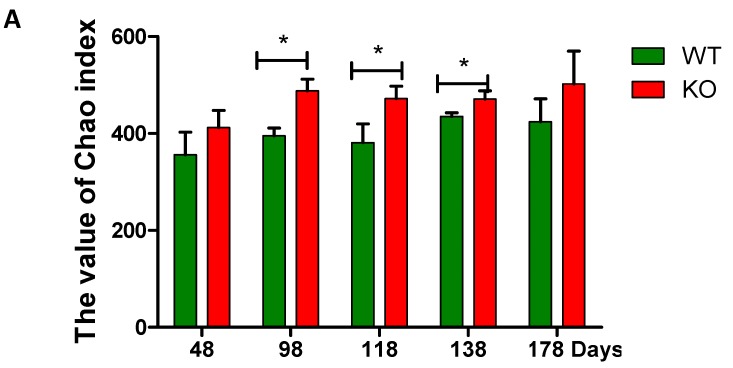
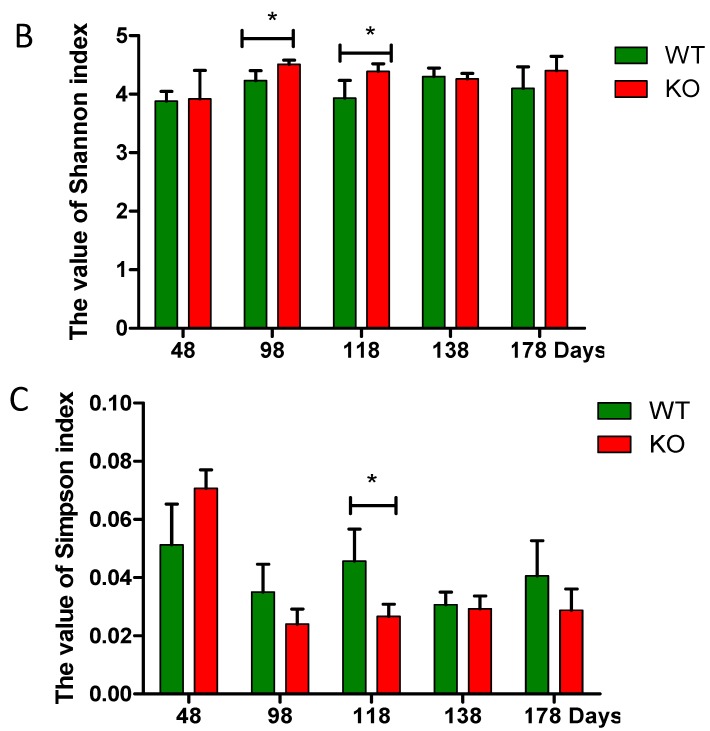
Figure 2.
Bacterial diversity analyzed by high-throughput sequencing. (A) Chao index; (B) Shannon index; (C) Simpson index. * indicated significant differences (p < 0.05) between Muc2−/− and Muc2+/+ mice. The results are presented as the mean ± SEM; n = 3 for each group. WT, Muc2+/+ mice; KO, Muc2−/− mice.


