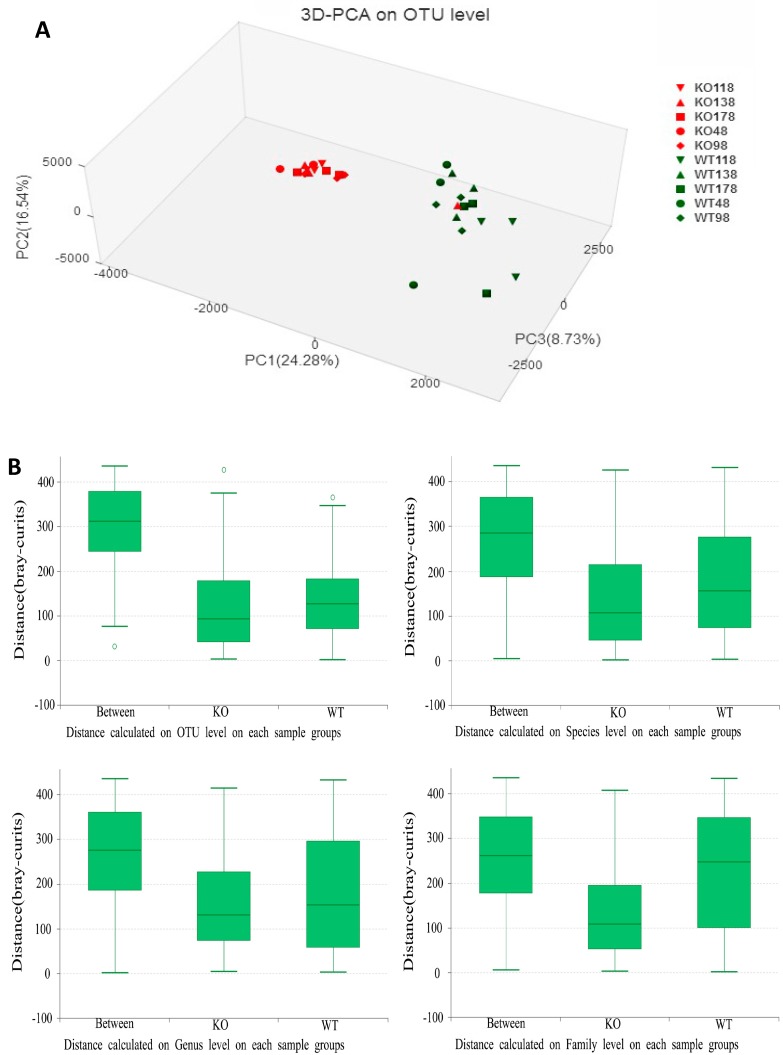
Figure 3.
Principal components analysis (PCA) of 16S rRNA gene-sequencing analysis of gut microbes obtained from the Muc2−/− and Muc2+/+ mice. (A) PC1, PC2, and PC3 explain 24.28%, 16.54%, and 8.73% of variation, respectively. WT, Muc2+/+ mice; KO, Muc2−/− mice. The sample names represented the sampling time and genotypes, e.g., KO48 indicated the samples collected from Muc2−/− mice at day 48, and WT48 indicated the samples collected from Muc2+/+ mice mouse at day 48. OTU—operational taxonomic units. (B) Analysis of similarities (ANOSIM) at different categorical levels were conducted. The middle line in the group “between” were higher than in “KO” (Muc2−/−) and “WT” (Muc2+/+) group, so the differences inter-treatment was bigger than that intra-treatment at family, genus, species and OTU levels in Muc2−/− and +/+ mice. “0” meant the normalization point.

