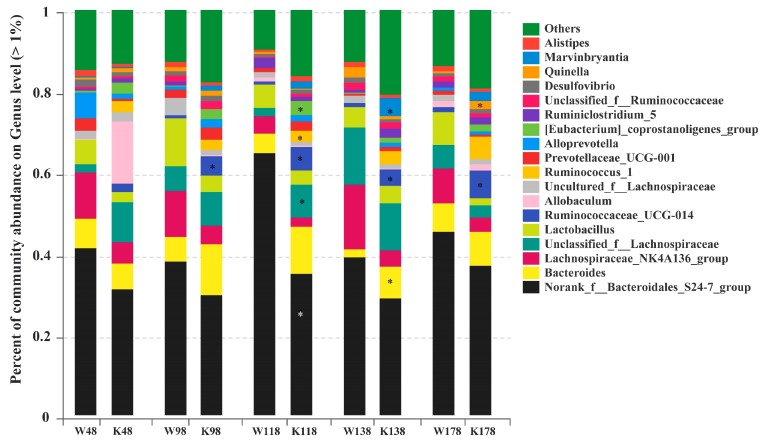
Figure 7.
Relative abundance of genus exceeding 1% in the Muc2−/− and Muc2+/+ mice at genus level and at different time points. * indicated the significant differences (p < 0.05) between Muc2−/− and Muc2+/+ mice. W, Muc2+/+ mice; K, Muc2−/− mice. The sample names at the x axis represented the sampling time and genotypes. For example, W48 indicated the samples collected from Muc2+/+ mice at day 48, and the K48 indicated the samples collected from Muc2−/− mice at day 48.

