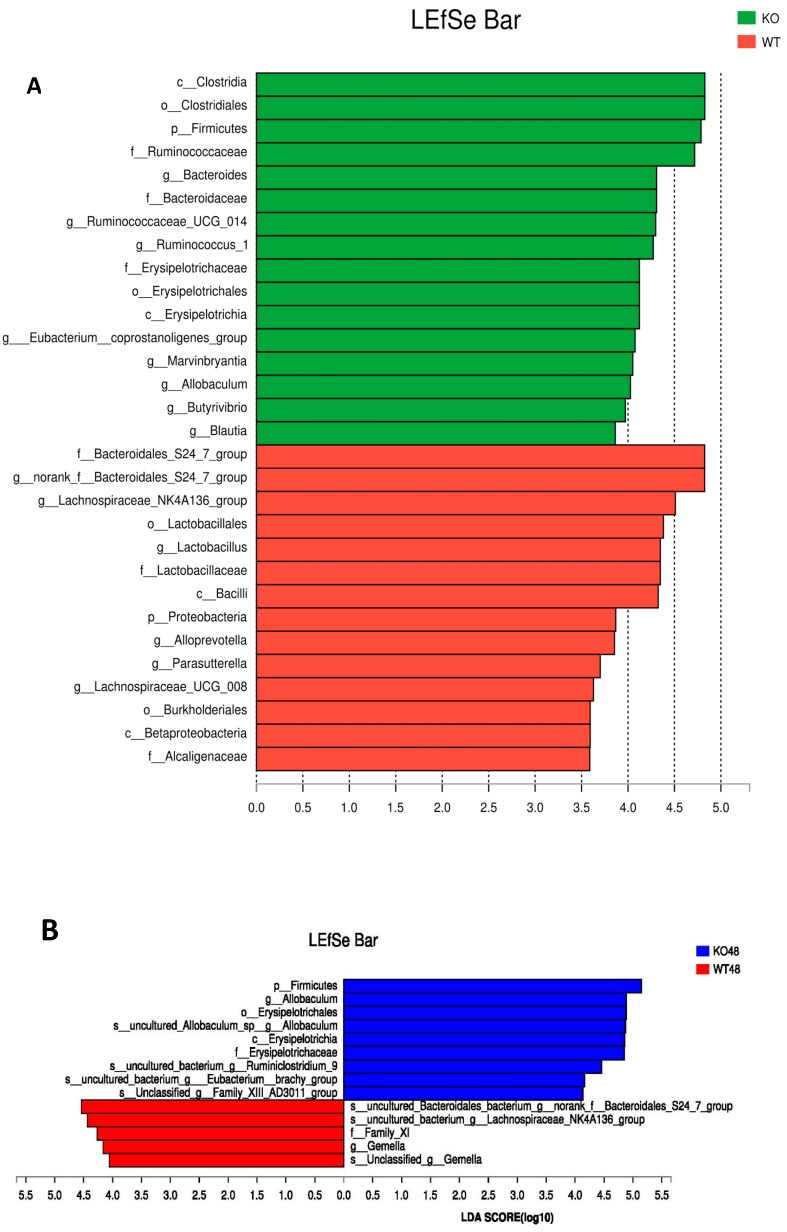
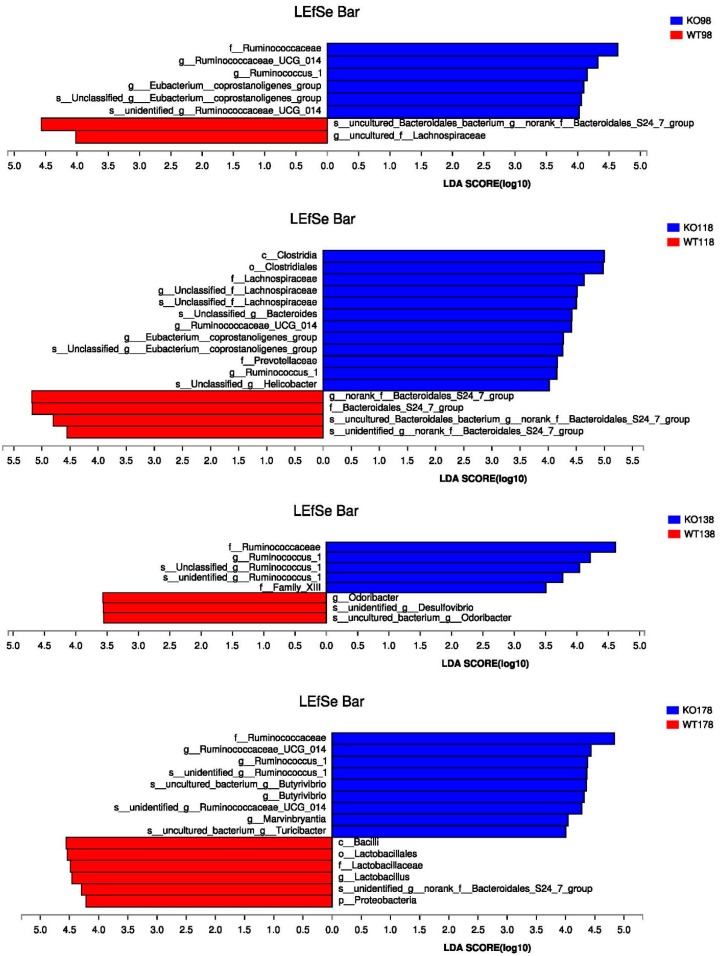
Figure 9.
Linear discriminant analysis (LDA) coupled with effect size measurement (LEfSe) analysis of gut microbes among Muc2−/− and Muc2+/+ mice. (A) Histogram of the linear discriminant analysis (LDA) scores for differentially abundant genera among Muc2−/− and Muc2+/+ mice; (B) the LEfSe analysis at different time points. WT, Muc2+/+ mice; KO, Muc2−/− mice.


