Figure 6.
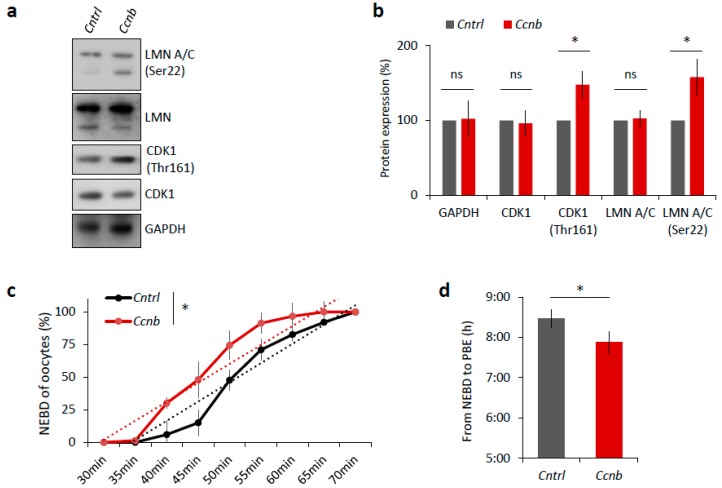
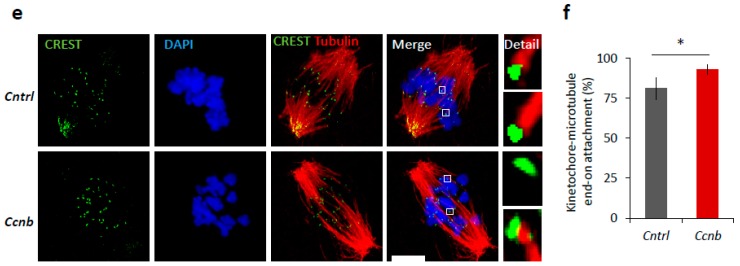
Elevated MPF activity is responsible for meiosis I acceleration in oocytes. (a) Western blot analysis of LMN A/C (Ser22), LMN A/C, CDK1 (Thr161), CDK1, and GAPDH in the post-NEBD oocytes (3 h) injected with Ccnb RNA or control Gfp RNA (Cntrl). See Figure S4 for the over-expression of CCNB in oocytes. Representative images from at least three experiments of biologically different samples. (b) Quantification of protein expression, LMN A/C, and CDK1 phosphorylation. From three experiments of biologically different samples. Values obtained for the YF group were set as 100%. Data represent mean ± SD; ns non-significant; * p < 0.05; Student’s t-test. (c) Timing of NEBD of YF oocytes microinjected with Gfp (n = 46; black line) and Ccnb cRNA (n = 51; red line). From three experimental data sets of biologically different samples. Trend line is depicted by dot lines. Data represent mean ± SD. * p < 0.05, Student’s t-test. (d) Time from NEBD to PBE in oocytes from YF injected with RNA coding for Gfp (n = 46; t = 8:25 h) and Ccnb (n = 51; t = 7:52 h). Data represent mean ± SD and data are from at least three experiments of biologically different samples. Student’s t-test. (e) Representative Z-projections from the assessment of cold stable attachments of kinetochores (KT, CREST, green) to microtubule (MT, tubulin, red) of oocytes microinjected with control Gfp and Ccnb cRNA. Representative images are from three experiments of biologically different samples (scale bar, 10 µm). (f) The percentage of cold stable end-on MT to KT attachments in each group averaged over multiple cells (n ≥ 28) 6 h post-IBMX-wash. Kinetochore-MT end-on attachments were quantified. The morphology of kinetochores analyzed is specified in detail. Data represent mean ± SD. * p < 0.05, Student’s t-test.


