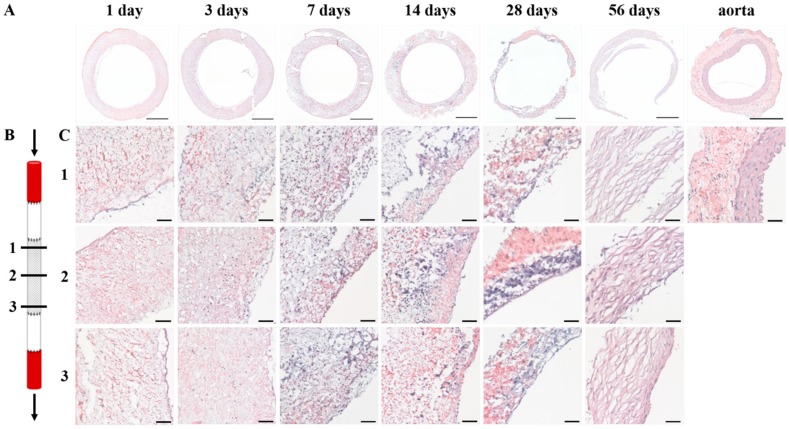
Figure 2.
General morphology of explants. (A) Weigert’s H&E stainings of cross-sections of the explants after 1, 3, 7, 14, 28, and 56 days after implantation and native aorta. Scale bars represent 500 µm; (B) Schematic overview of the proximal (1), center (2), and distal (3) transection of the PCL2000-U4U scaffold. Arrows indicate blood flow; (C) Weigert’s H&E stainings of the explants after 1, 3, 7, 14, 28, and 56 days after implantation at the different locations in the scaffold, as illustrated in (B). Lumen is located at the right side of each picture. Scale bars represent 50 µm.

